Background Information
A telecommunications company (“SuperTel”) contracted a vendor (“TPF”) for $15 million per year to audit the phone calls for their customer service call centers. TPF convinced SuperTel they could monitor the calls of their phone agents to detect if they are exhibiting ideal behaviors like building a rapport with the customer, or actively listening to the customer, etc.
TPF’s claim was that these agent behaviors would improve SuperTel’s customer satisfaction scores (a very critical metric for SuperTel). TPF claimed that by detecting these agent behaviors and therefore holding the phone agents accountable to improve these behaviors, then it would ultimately improve SuperTel’s customer satisfaction scores.
The Problem
The results from TPF’s analyses were always inconsistent where no clear or decisive action could be made. Their data also didn’t seem to coincide with their original assumption that the behaviors of the phone agents on the calls are correlated to or could influence customer satisfaction. There were two basic objectives for this project:
- Validate TPF’s data to ensure it’s reliable.
- Validate TPF’s claim that phone agent behavior is correlated to customer satisfaction.
The Analysis: Data Collection
TPF evaluated a sampling of audio-recorded calls provided by SuperTel. TPF call auditors identified over 50 different behaviors and characteristics per call. Their data was tracked in a spreadsheet where each call was a single row with different values listed across the 50+ columns of characteristics they tracked per call. For the agent behaviors, they simply tracked it as a discrete value indicating “YES” if the behavior was identified and “NO” if the behavior was not identified.
To do the analysis, we pulled TPF’s data across two months for all calls audited by 18 different auditors across 16 different call centers. It resulted in a sampling of over 1,000 calls. We also ensured the data we analyzed all had a customer satisfaction survey result which was tracked in two ways: 1) “was your issue resolved” was a discrete answer of YES or NO, and 2) “how satisfied were you with your call” or “how likely are you to promote SuperTel” which either had a small likert scale from 1 (low value) to 10 (high value).
The Analysis: Data Validation
As a general rule when doing data analysis to assess if factor X is a key driver for factor Y, the only variation you want to allow in your data is for factor X; all other factors that may influence factor Y should be held as constant as possible. In this case with TPF’s data, if they were properly evaluating the agent behaviors (where each is like factor X) to see if they influence customer satisfaction (factor Y), then we should expect to see all other potentially influencing factors held constant (like a random distribution of calls being evaluated by the auditors, the auditors should be consistent in their evaluations, etc.).
Finding #1: Calls are not randomly distributed across all TPF Auditors
The calls being distributed across TPF’s auditors were not random. See the chart below illustrating the results. The columns represent each of TPF’s 18 different auditors and the colors in each of their columns represent the portion of calls they reviewed across the 16 different call centers (there are 16 different unique colors illustrated).
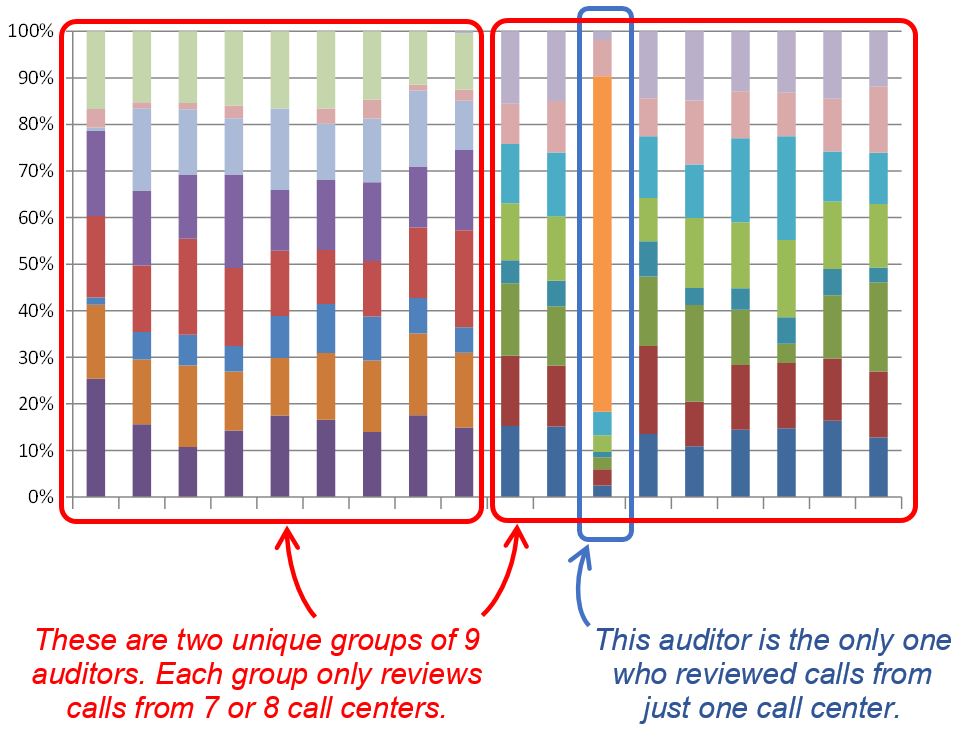
Please note that the number of colors and what they represent don't matter. What does matter is the pattern of colors. That is, if the calls were randomly distributed, we’d expect to see the color pattern being relatively consistent across each column. However, instead we see 3 different groups:
- Nine auditors only reviewed calls from eight call centers.
- Nine different auditors only reviewed calls from seven different call centers.
- One auditor reviewed all the calls from one call center.
Does this inconsistency in distributing calls across auditors cause the data to be unreliable? Not necessarily. If the auditors are all proven to be accurate and consistent in reviewing the behaviors for phone agents, then this may not be a risk. However, any inconsistency between the auditors means we must limit the analysis to the data at the call center level rather than at an aggregate level (e.g., across all SuperTel call centers, or by SuperTel’s lines of business, etc.).
Finding #2: TPF Auditors are not consistent between each other in tracking behaviors
If TPF’s auditors were following a standard process for evaluating phone agent behaviors, then we’d expect there to be consistency across those auditors in detecting whether the phone agents exhibited the behaviors or not. Even though there wasn’t a random distribution of calls across all auditors and call centers, for that subset of auditors who did have a random distribution of calls, we should still see consistent tracking of behaviors.
The Interval Plot below displays the results for just 9 auditors reviewing calls at one call center and their results from month-to-month (February and March) for just one behavior: active listening. The fact that there are some auditors having a very wide disparity in tracking just one behavior like active listening shows they’re following different standards in identifying when the agent is actively listening.
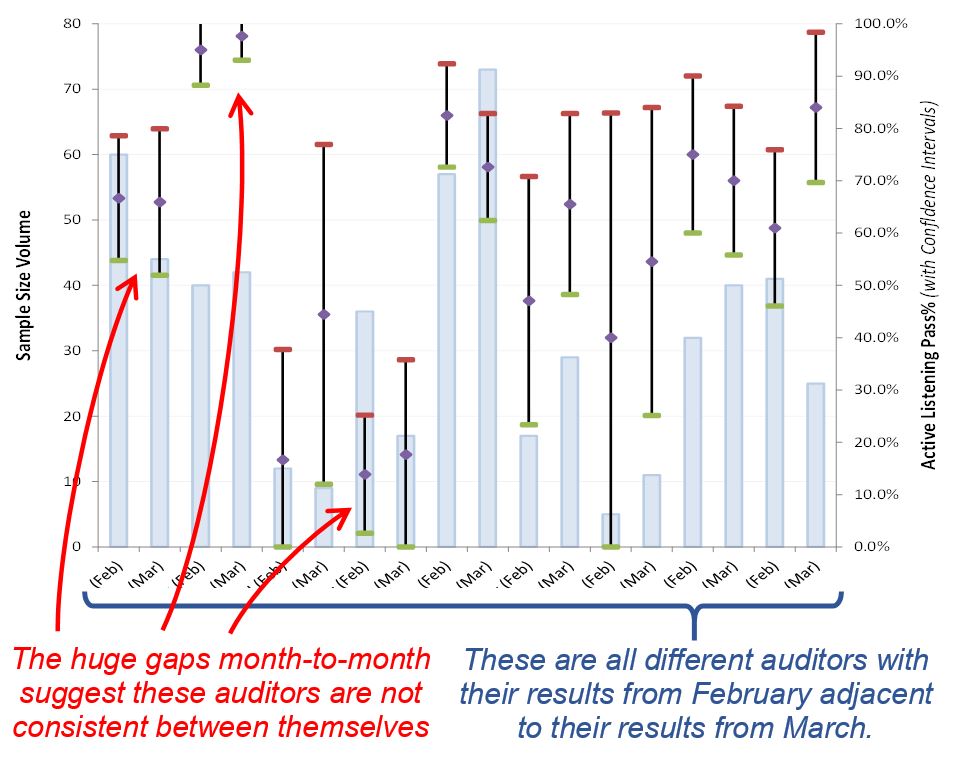
Does this inconsistency between auditors create a significant risk? Absolutely! When conducting a Measurement System Analysis (MSA), this finding represents a failure in reproducibility (i.e., they’re not consistent between different auditors).
For example, suppose one of those auditors left the company and he was prone to score more favorably for active listening; the calls he would’ve audited could be routed to another auditor who follows a more stringent standard for identifying active listening. If that happens, then even though a phone agent may have never changed his actual phone behavior, he would be treated as if he wasn’t actively listening anymore.
Finding #3: TPF Auditors are consistent within themselves in tracking behaviors
Despite TPF’s auditors not receiving a consistent distribution of calls to review and despite the inconsistency between auditors, these TPF auditors were found to be consistent within themselves. This is another key aspect of the MSA that evaluates the repeatability among operators. That is, it assesses if the auditors are consistent within their own evaluations for tracking behaviors in the calls they review. For example, a failure in auditor repeatability would be if an auditor listened to the same call twice and tracked the agent behaviors differently each time they listened, such as if they let other things influence their ability to track behaviors, listening to each call at different times of day, days of week, etc.
The Interval Plot below is the same as the previous example where it displays the results for just 9 auditors reviewing calls at one call center and their results from month-to-month (February and March) for just one behavior: active listening.
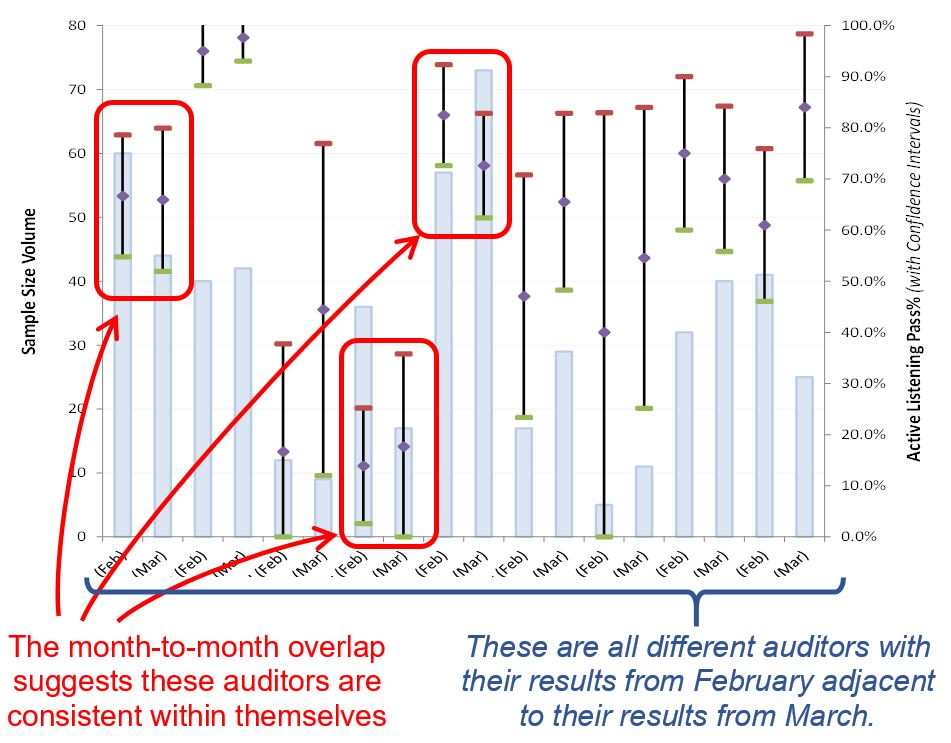
A two proportions test could confirm that there’s no statistical difference from month-to-month for how these auditors assessed active listening for these calls; it would likely yield a high p-value (i.e., suggesting a high risk of error in claiming a statistical difference between each month per auditor). However, since there’s so much overlap as illustrated in the interval plot, a two proportions test isn’t necessary.
The Findings: Summary and Conclusion
Overall, TPF’s data failed 2 out of 3 tests:
- Are the calls randomly distributed across all auditors? No. This creates a potential risk.
- Are the auditors consistent between each other? No. This is a high risk.
- Are the auditors consistent between themselves? Yes. This presents no risk.
TPF’s data was concluded to be unreliable due to the inconsistency between their auditors (a MSA failure in reproducibility). This proves their auditors are not following a standard process for detecting the key behaviors from the phone agents. As such, that means the risk from TPF distributing the calls in a non-random way across all their auditors makes that failure an even bigger risk. The fact that the auditors were consistent within themselves (i.e., they passed the MSA repeatability test) does not mitigate the risks from the other MSA failures.
As a result, we met our objective to test the reliability of TPF’s data. But since their data were found to be unreliable, then there is no need to work on the 2nd objective of validating TPF’s claim that phone agent behavior is correlated to customer satisfaction.
The Final Project Results
We first met with TPF’s statistical experts who provided the data for our analysis to ensure we were properly interpreting and analyzing the data they provided. We also wanted to validate that any assumptions we made were valid and that there were no other factors or issues we should account for in our analysis.
We then met with TPF’s senior executive leadership to review our analysis findings. Our approach was to work closely with them so we can design a new standard process for their auditors to follow and help them employ a new process that eliminates the risks and failures we discovered.
Surprisingly, the TPF leadership was not willing to accept our help and support to modify their processes despite the results of the analysis they weren’t able to disprove. Therefore, SuperTel’s executive leadership terminated the $15M/yr contract with TPF.
SuperTel had a small support staff that managed the relationship with TPF and handled the additional reporting and analysis based on TPF’s original data. Instead of terminating these employees along with the TPF contract, SuperTel re-purposed this team where they designed their own standard processes for evaluating phone agent behaviors and conducted their own internal analysis as originally intended from TPF.
About StatStuff
StatStuff is the only FREE source for complete Lean Six Sigma training. It is highly endorsed as quality Lean Six Sigma training from leaders at top companies like Apple, eBay, Pepsico, Bank of America, Dell, Sprint, BP, etc. Many other training organizations offer similar LSS training content for $2,000 - $7,000 and their training lasts 40 to 200 hours long. StatStuff’s free online training content is less than 28 hours – plus StatStuff offers Beginner and Intermediate training paths that can be completed in far less time. Many companies, training organizations, and universities are using StatStuff for their training curriculum. And why shouldn't they? There’s no risk, it’s less time, less money, and what better way is there to teach Lean Six Sigma than to apply Lean Six Sigma to their own training plan?