What are the background details in this case study?
Based on this "IRS Hit List" article from the Wall Street Journal, there’s a class-action lawsuit against the IRS claiming they slow-walked applications for tax exempt status. The article describes how they were recently court-ordered to provide a list of 426 groups in question where ~30% of the groups have names containing keywords (like “tea”, “patriot”, “constitution”, “liberty”, etc.) that suggest a certain political affiliation. Regardless of our own political leanings, this behavior is unacceptable for a U.S. government organization.
What is the Big question?
The big question we want to ask in this analysis is "Did the IRS demonstrate politically-motivated bias in processing tax exempt status applications?" When we do an analysis, it helps to ask simple Yes/No questions like this so that we can get in the right mindset for finding what data and statistical test will definitively answer that question.
What is the statistical analysis method should be used?
Apart from witness testimony or written documentation, it’s extremely difficult to prove the IRS leadership employed politically-motivated bias in this process. However, some simple statistical analysis could create compelling evidence that either proves the IRS did or did not have bias.
But before we go further, how would you analyze it? What type of data and statistical tools would you use to test this? No seriously, before you scroll to see the answer, take a few moments to think through how you would analyze it.
Hint #1
Ask yourself "What’s the real statistical question behind this situation?" Try to answer this before scrolling down any further for the next hint.
Hint #2
Now try to think backwards, starting with the end in mind. Think like you’re either the defendant (IRS) or the plaintiff to see what kind of evidence you’d want to prove your case. What statistical tool(s) could help you prove that case? Then, what data would you need for that statistical tool? Again, Try to answer this before scrolling down any further for the next hint.
Matt's Answer
Here’s what I believe to be the statistical question behind this: “If 30% of the identified groups contain the keywords suggesting bias, then is that 30% statistically representative of the population?” If YES, then that should prove the IRS did not have bias; but if NO, then it strongly suggests they did have bias.
How do you test this? The IRS simply needs to identify ALL (or an unbiased, representative sampling) tax-exempt applications they received in the time period in question (or at least in the time period of the 426 groups they already identified). Search all those groups to see what portion of them contain those same keywords. Using a Two Proportions Test (or even a visual depiction using an Interval Plot), we can determine with 95% confidence whether the 30% in the 426 identified groups is truly representative of the population.
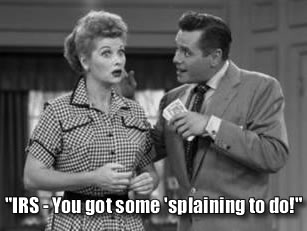
Keep in mind that the results cannot necessarily be applied equally; that is, it can prove the innocence, but not necessarily the guilt of the IRS. For example, if the test reveals there is NO bias (innocence), then I believe that’s very strong evidence in favor of the IRS. However, tests like these don’t necessarily prove the opposite (guilt); that is, we can’t prove from this test there IS bias – the best we can say is that there’s enough to data to show the likelihood of bias. This is where the “guilt beyond a reasonable doubt” comes in. That is, just like Ricky Ricardo would say “Lucy, you got some ‘splaining to do”, the IRS would have to provide very compelling reasons to explain why they’re not as statistically innocent of bias as they claim.
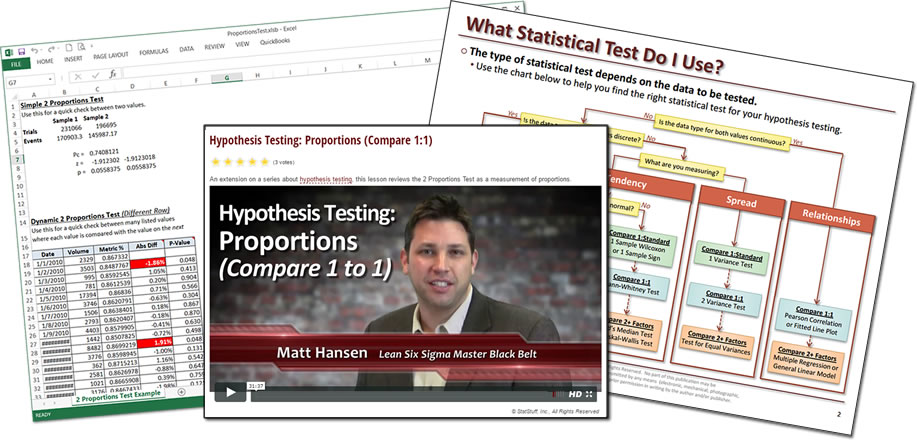
To learn about this Two Proportions Test, check out my free video where I also include a free download of a map of many statistical tests plus an Excel file that has built-in functionality for a dynamic version of the Two Proportions Test.
About StatStuff
StatStuff is the only FREE source for complete Lean Six Sigma training. It is highly endorsed as quality Lean Six Sigma training from leaders at top companies like Apple, eBay, Pepsico, Bank of America, Dell, Sprint, BP, etc. Many other training organizations offer similar LSS training content for $2,000 - $7,000 and their training lasts 40 to 200 hours long. StatStuff’s free online training content is less than 28 hours – plus StatStuff offers Beginner and Intermediate training paths that can be completed in far less time. Many companies, training organizations, and universities are using StatStuff for their training curriculum. And why shouldn't they? There’s no risk, it’s less time, less money, and what better way is there to teach Lean Six Sigma than to apply Lean Six Sigma to their own training plan?


